Not having the appropriate marketing budget can do significant damage to your company’s potential. Like Henry Ford said, “The man who stops advertising to save money, is like the man who stops a clock to save time.” Cutting back your marketing and advertising costs is not the path to a prosperous business.
But how much do companies spend on marketing in your industry? Having an accurate estimate of what the average marketing budget can be important to know for several reasons.
Jump to Our Marketing Budget Calculator
Knowing your numbers matter whether you’re trying to structure your marketing plan, justifying a round of new funding, or approaching your boss about a marketing budget increase for the next fiscal year.
What Percentage of Revenue Should Be Spent on Marketing?
For years, the average marketing budget for small businesses was a recommended 7-8% of revenue, per the SBA. This marketing budget percentage supposedly held true if your revenues were under $5 million and your margins were between 10% and 12% of sales.
As a small business owner, including a marketing budget in your marketing plan is a necessary step toward raising funds for growth. However, there are several business factors that will affect this figure like your marketing goals, your industry, and whether you serve businesses or consumers.
However, since this figure was released, large strides have been made in the world of digital media and smartphones. Not to mention, a global pandemic rocked the world and has already changed what we know about face to face marketing initiatives and daily commutes.
The next sections show the average marketing budget breakdown for B2B vs. B2C companies, 13 different industry segments, and how these percentages will be affected by COVID-19.
B2B vs. B2C
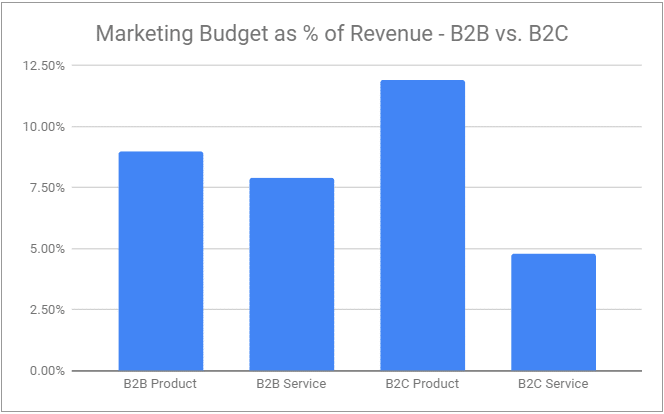
Your average marketing budget will depend largely on whether your business serves businesses or consumers, and whether you offer mainly product or services.
The following table and chart represent the average marketing budget for B2B companies and B2C companies segmented by product and service offerings.
| Market Segment | % of Revenue |
| B2B Product | 9.00% |
| B2B Service | 7.90% |
| B2C Product | 11.90% |
| B2C Service | 4.80% |
Average Marketing Budget by Industry
B2B marketing budget vs. B2C marketing budget comparisons only go so far when industry variation is added to the mix.
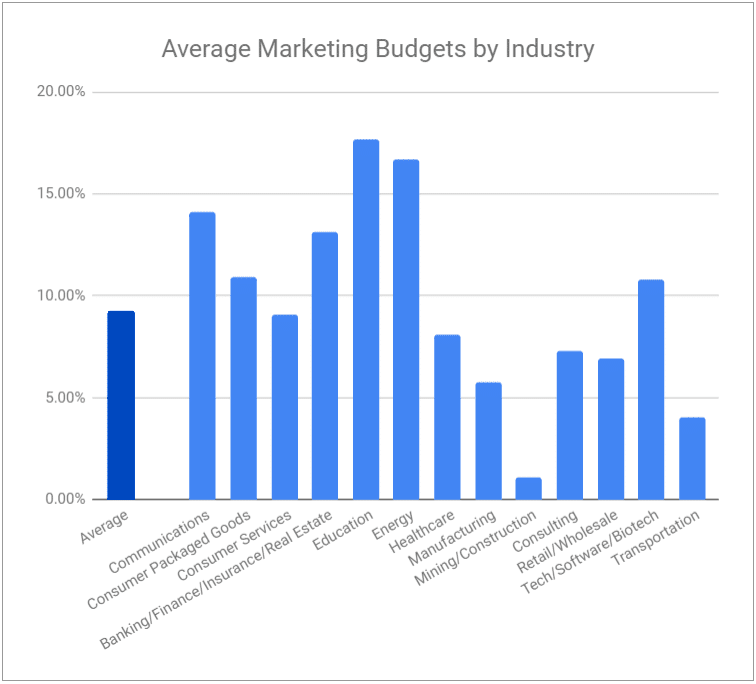
Case in point, the Manufacturing industry reports marketing budgets as 5.74% of revenue while Banking and Finance reports an average of 13.14% of revenue. With such a wide gap, it’s clear you must take a more granular look at the playing field before making an informed estimate about your own projected marketing expenses.
It’s important to recognize that about 79% these marketing budget percentages include the cost of marketing employees. For companies that use outsourced marketing services, their income statement doesn’t include a payroll expense that can be allocated to marketing workers.
The following data on the marketing budget as a percentage of revenue by industry was pulled and aggregated from an August 2019 and February 2020 report by CMO Survey.
| Industry Segment | % of Revenue | |
| Communications | 14.09% | |
| Consumer Packaged Goods | 10.92% | |
| Consumer Services | 9.09% | |
| Banking/Finance/Insurance/Real Estate | 13.14% | |
| Education | 17.67% | |
| Energy | 16.70% | |
| Healthcare | 8.12% | |
| Manufacturing | 5.74% | |
| Mining/Construction | 1.10% | |
| Consulting | 7.28% | |
| Retail/Wholesale | 6.93% | |
| Tech/Software/Biotech | 10.78% | |
| Transportation | 4.02% | |
| Average | 9.25% |
Marketing Budget Calculator
Your estimated annual revenue:
Choose industry segment:
Estimated Marketing Budget:
Effect of COVID-19 on Marketing Budgets
So, how much should you spend on marketing your business… during or after a global pandemic? The above marketing budget figures by industry may have held true for the past several years, but are they representative of the world today?
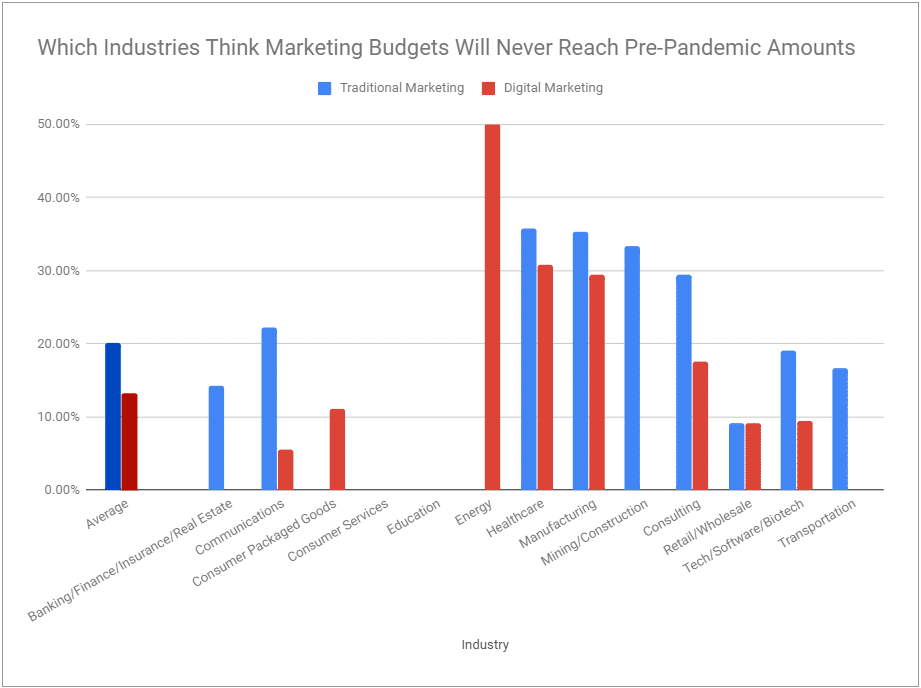
A June 2020 survey by CMO survey asked, “When will budgets return to pre-pandemic levels?” The following chart represents how many marketing leaders from each industry answered “Never” regarding traditional and digital marketing budget rebounds.
Average Marketing Budget Allocation by Channel
By now, you should have a better answer to the question, “How much should a small business budget for marketing?” However, this doesn’t tell you which marketing strategies you should be executing with your newly established budget.
Benchmark Allocation
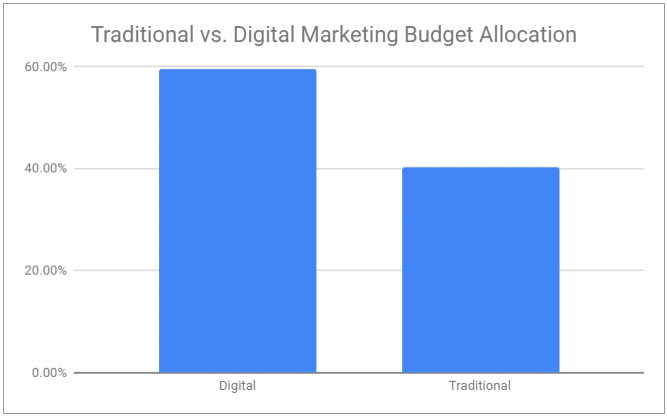
It pays to know (literally) where the rest of the U.S. invests their marketing dollars. Research from eMarketer paints us a picture of a projected 2020 marketing budget breakdown in the U.S.
| Channel | Allocation (%) | |
| Digital | 59.60% | |
| Traditional | 40.40% | |
| TV | 26.40% | |
| 4.90% | ||
| Radio | 5.50% | |
| Out-of-home | 3.20% | |
| Directories | 0.40% | |
If you’ve been trying to answer the question, “How much should I pay for digital marketing vs. traditional marketing?” These numbers give you a better indication.
Keep in mind, there are huge national brands that can skew this data. Because of the expense of traditional TV advertising, it can appear disproportionately large. As a provider of both digital and traditional marketing in Texas, we get a large volume of requests for Austin and Houston print design.
It’s also important to recognize that many traditional channels have been migrating to digital. For example, the radio figures above don’t include digital radio and music streaming services which have become massively popular over the past several years.
For many businesses that have historically used traditional marketing, making the move over to a more digital approach doesn’t have to be painful. Our team has experience with B2B web design like industrial or manufacturing web design, that can help improve your digital presence. When you combine a polished site with digital marketing for manufacturers, like SEO for manufacturers or social media for manufacturers, your bottom line is sure to see growth.
Highest ROI Channels
There are several effective marketing channels you could include in your strategy, but we recommend scheduling a free consultation with our team to determine which channels are best for your business.
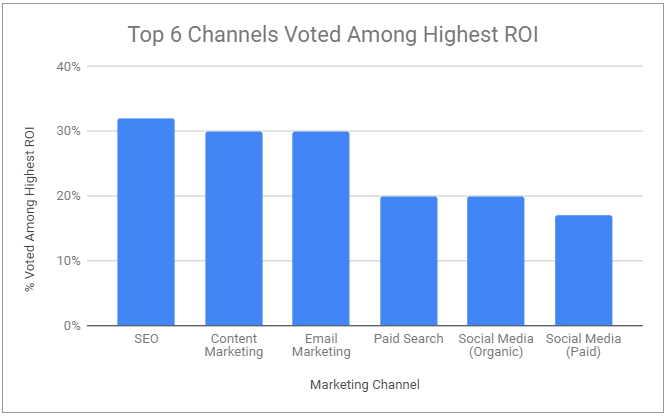
The following chart shows which channels were voted among the highest ROI at the companies of over 600 businesses. This data from a Smart Insights gives us a clear idea of the channels which may have the best return for your budget.
| Marketing Channel | % Voted Among Highest ROI |
| SEO | 32% |
| Content Marketing | 30% |
| Email Marketing | 30% |
| Paid Search | 20% |
| Social Media (Organic) | 20% |
| Social Media (Paid) | 17% |
As a full-service, integrated marketing agency in Texas, MARION offers all of the above to help your marketing succeed across all relevant channels.
Sample Marketing Budget
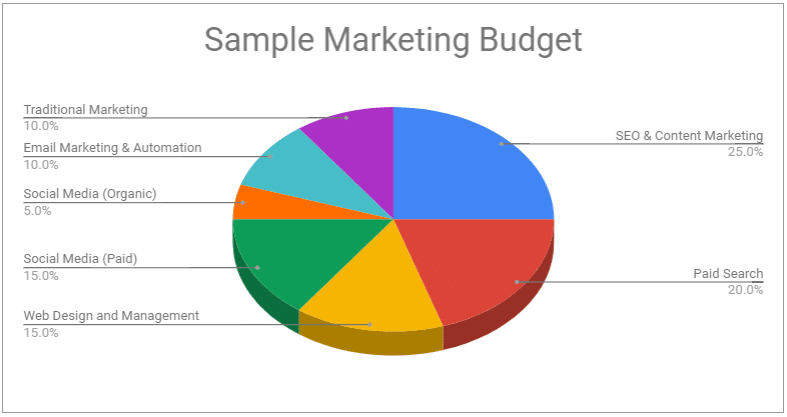
Trying to set and optimize a corporate marketing budget can be difficult. We’ve included a sample marketing budget breakdown in the pie chart below as a possible example.
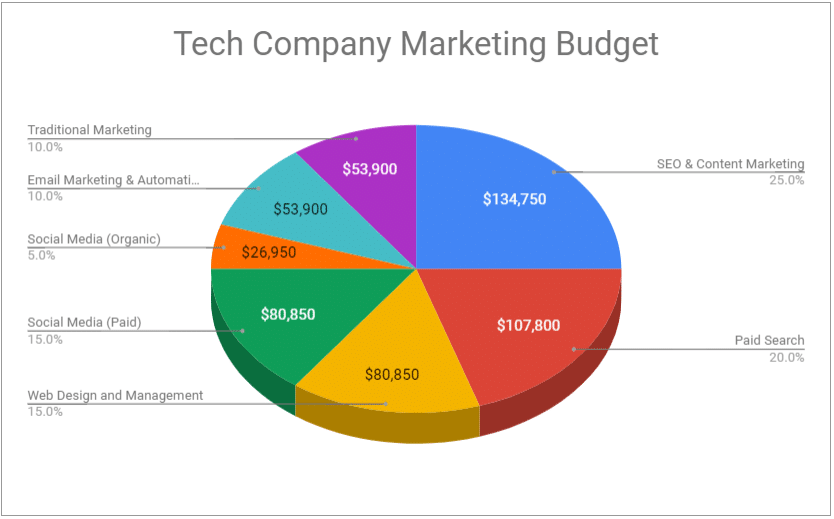
Use a tech company with annual revenues of $5 million as an example. If the average marketing and advertising budget in the tech industry is 10.78% of revenue, then the total marketing budget would be $539,000.
The breakdown for our tech company would be as follows.
Industry: Tech
Annual Revenue: $5,000,000
Marketing Budget: $539,000
Contact MARION for Expert Help with Marketing Your Business
MARION has been helping Texas businesses for nearly 40 years. We have the people and processes in place to serve your business needs for nearly any channel across most industries. Our competencies include SEO, web design, content marketing, email marketing and automation, PPC, social media marketing, trade show display design, and print and collateral design.
Contact a member of our team today for a free consultation, and we’ll implement a growth plan together.


